In this article, we will share MP Board Class 10th Maths Book Solutions Chapter 14 Statistics Ex 14.4 Pdf, These solutions are solved subject experts from the latest edition books.
MP Board Class 10th Maths Solutions Chapter 14 Statistics Ex 14.4
Question 1.
The following distribution gives the daily income of 50 workers of a factory.
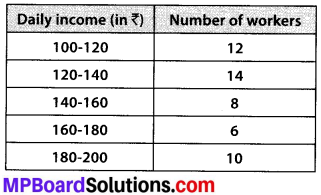
Convert the distribution above to a less than type cumulative frequency distribution, and draw its ogive.
Solution:
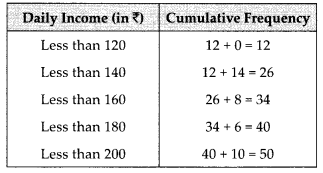
We have the cumulative frequency distribution as follows:
Now, we plot the points corresponding to the ordered pair (120, 12), (140, 26), (160, 34), (180, 40) and (200, 50) on a graph paper and join them by a free hand to get a smooth curve as shown below:
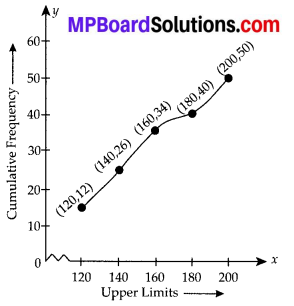
The curve so obtained is called the less than ogive.
![]()
Question 2.
During the medical check-up of 35 students of a class, their weights were recorded as follows:
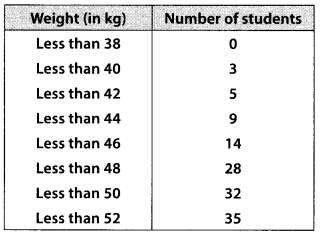
Draw a less than type ogive for the given data. Hence obtain the median weight from the graph and verify the result by using the formula.
Solution:
Here, the values 38, 40, 42, 44, 46, 48, 50 and 52 are the upper limits of the respective class-intervals.
We plot the points (ordered pairs) (38, 0), (40, 3), (42, 5), (44, 9), (46,14), (48, 28), (50, 32) and (52, 35) on a graph paper and join them by a free hand to get a smooth curve.
The curve so obtained is the less than type ogive.
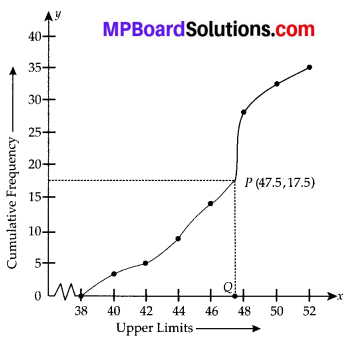
∵ N = 35
∴ \(\frac{N}{2}=\frac{35}{2}\) = 17.5
The point 17.5 is on y-axis.
From this point (i.e., from 17.5) we draw a line parallel to the x-axis which cuts the curve at P. From this point P, draw a perpendicular to the x-axis, meeting the x-axis at Question The point Q represents the median of the data which is 47.5.
Verification:
To verify the result, let us make the following table in order to find median using the formula :
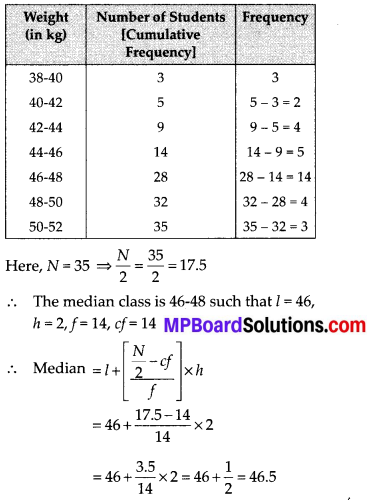
Thus, the median = 46.5 kg is approximately
![]()
Question 3.
The following table gives production yield per hectare of wheat of 100 farms of a village
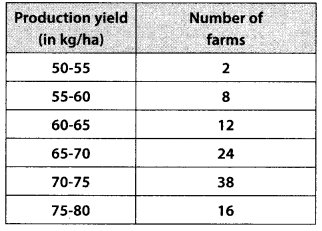
Change the distribution to a more than type distribution, and draw its ogive.
Solution:
For more than type distribution, we have
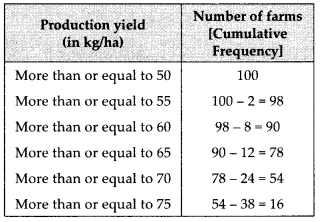
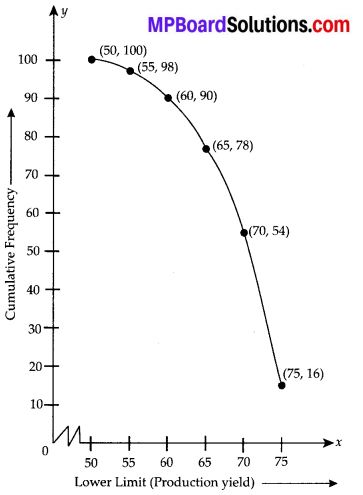
Now, we plot the points (50, 100), (55, 98), (60, 90), (65, 78), (70, 54) and (75, 16) and join the points with a free hand to get a smooth curve.
The curve so obtained is the ‘more than type ogive’.