MP Board Class 11th Economics Important Questions Unit 2 Collection, Organisation and Presentation of Data
Collection, Organisation and Presentation of Data Important Questions
Collection, Organisation and Presentation of Data Objective Type Questions
Question 1.
Choose the correct option:
Question (a)
When is ‘India’s coalition done:
(a) Every first year of every decade
(b) Every first year of century
(c) Every year
(d) Every five year.
Answer:
(a) Every first year of every decade
Question (b)
State another name of Random Sampling:
(a) Chance sampling
(b) Drum Rotation method
(c) Lottery
(d) All of these.
Answer:
(d) All of these.
Question (c)
First step of presentation of data is:
(a) Categorisation
(b) Tabulation
(c) Both (a) and (b)
(d) None of these.
Answer:
(a) Categorisation
![]()
Question (d)
Which law should be kept is mind while and making tables:
(a) Correct size
(b) Correct measurement of unit
(c) Correct unit
(d) All of these.
Answer:
(d) All of these.
Question (e)
In what type of papers pictures are drawn:
(a) Graph paper
(b) White paper
(c) Any
(d) None of these.
Answer:
(b) White paper.
Question 2.
Fill in the blanks:
- ………………………… provides real data.
- ………………………… is present population data of India.
- When data is categorised according to time it is called ……………………………..
- Presentation of data in the form of table is called ………………………………
- Bar diagram is a ………………………… diagram.
Answer:
- Researcher
- Census of India
- Chronological
- Tabulation
- Unit.
Question 3.
Match the columns:

Answer:
- (c)
- (a)
- (e)
- (b)
- (d).
Question 5.
Answer in one word:
- What is simple curve called?
- In how many year population calculation is done is India?
- What is the other name of Pie diagram?
- Pie diagram is also known as?
- How many sources are there of index?
Answer:
- Bell shaped curve
- 10 yrs
- Primary
- Circular
- Two.
Collection, Organisation and Presentation of Data Very Short Answer Type Questions
Question 1.
What is bivariate frequency distribution?
Answer:
A bivariate distribution is the frequency distribution of two variables.
Question 2.
What is complete census method?
Answer:
It is a method of data collection in which data are collected for each and every unit of the population which constitutes the subject matter of the study.
Question 3.
What is sample?
Answer:
A sample refers to a group or section of the population from which data are obtained.
![]()
Question 4.
What is Random sampling?
Answer:
Method in which each and every item of the universe has an equal chance of being selected in the sample is called Random sampling.
Question 5.
What is Non – Random sampling?
Answer:
In Non – Random sampling every individual does not have an equal chance of being selected.
Question 6.
What is statistical error?
Answer:
The difference between the collected data and actual value of facts is termed as statistical errors.
Question 7.
When does statistical error occurs?
Answer:
When size of sample is kept small then statistical error occurs.
Question 8.
Define variable?
Answer:
A phenomenon which is capable of being measured and changes its value overtime is called a variable.
![]()
Question 9.
How many rows and columns are required to make a table?
Answer:
There must be atleast two rows and two columns required to make a table.
Question 10.
Who is a enumerator?
Answer:
Enumerators are the persons who help the investigators in collecting the data.
Question 11.
What is the aim of collecting data?
Answer:
The aim of collecting data is to collect the evidence for the solution of any problem.
Question 12.
What is observation?
Answer:
An observation is the value at a particular period of a particular variable.
Question 13.
What is primary data?
Answer:
Primary data are the original data which are collected by the investigator himself.
Question 14.
What is secondary data?
Answer:
Secondary data refers to those data which are collected through other sources. These are not original.
Question 15.
What is interview method?
Answer:
The method in which researchers collect the informations from various persons is called interview method.
![]()
Question 16.
Define Questionnaire?
Answer:
A questionnaire consists of a list of questions pertaining to the investigation.
Question 17.
You will have to collect information from such a person who lives in a remote village of India. Which method will be suitable to collect data from that person?
Answer:
Mailing method.
Question 18.
Define survey?
Answer:
Survey is such a method through which informations is collected from different persons.
Question 19.
What is the objective of survey?
Answer:
The objective of survey is to collect informations about a product or a person.
Question 20.
What is organization of data?
Answer:
Organization of data refers to the arrangement of figures in such a form that comparison of the mass of similar data may be facilitated and further analysis may be possible.
![]()
Question 21.
What is frequency distribution?
Answer:
It refers to a technique by which variables are grouped in statistical series.
Question 22.
What is class?
Answer:
A range of values which incorporate a set of items is called a class.
Question 23.
What is class limits?
Answer:
The extreme values of a class are limits.
Question 24.
What is mid value?
Answer:
Mid value is the average value of upper and lower limits.
Question 25.
Define class size?
Answer:
Size of class refers to the size of the class interval or it refers to width of the class.
![]()
Question 26.
Define cumulative frequency?
Answer:
In cumulative frequency series, frequency of the class intervals are aggregated. There are formed by adding the successive or preceding frequencies in the groups.
Question 27.
What is exclusive series?
Answer:
Exclusive series is that series in which every class interval excludes items corresponding to its upper limit.
Question 28.
What is inclusive series?
Answer:
An inclusive series is that series which includes all items up to its upper limit.
Question 29.
What is range?
Answer:
The difference between upper limit and lower limit is called range.
Question 30.
Define classification?
Answer:
Classification is the process of arranging data into sequences and groups according to their common characteristics of separating them into different his related parts.
![]()
Question 31.
What is qualitative classification?
Answer:
When statistical data are classified with reference to attributes such as, employment, literacy, honesty, colour etc., is called qualitative classification.
Question 32.
What is multiple bar diagram?
Answer:
Multiple bar diagrams are those diagrams which show two or more sets of data simultaneously.
Question 33.
What is diagrammatic presentation?
Answer:
It is a geometric technique of presenting statistical data through bar diagrams and pie diagrams.
Question 34.
Define frequency?
Answer:
Frequency is the number of times an item occurs (or repeats itself) in the series.
Question 35.
What is presentation of data?
Answer:
The presentation of data means exhibition of the data in such a clear and attractive manner that these are easily understood and analysed.
![]()
Question 36.
What is circular or Pie diagram?
Answer:
Pie diagram is a circle divided into various segments showing the percent values of a series.
Question 37.
Why is multiple bar diagram prepared?
Answer:
It is prepared to show two or more sets of data simultaneously.
Question 38.
What is percentage bar diagram?
Answer:
Percentage bar diagrams are those diagrams which show simultaneously different parts of the values of a set of data in terms of percentages.
Question 39.
Write a formula to determine range?
Answer:
Range = Number of classes Size of classes.
Question 40.
What is bar diagram?
Answer:
Bar diagrams are those diagrams in which data are presented in the form of bars or rectangles.
![]()
Question 41.
What is frequency polygon?
Answer:
Frequency polygon is formed by joining mid points of the tops of all rectangles in a histogram.
Question 42.
What is frequency curve?
Answer:
A frequency curve is a curve which is plotted by joining the mid points of all tops of histogram by free hand smoothed curves.
Question 43.
Define cumulative frequency curve?
Answer:
It is the curve which is constructed by plotting cumulative frequency data on the graph paper in the form of a smooth curve.
Question 44.
Which measure of central tendency can be obtained by histogram?
Answer:
Mode.
Question 45.
Which measure of central tendency can be obtained by ogive?
Answer:
Median.
![]()
Question 46.
What is time series graph?
Answer:
When the values of numerical data correspond to time series data, graphic presentation of these data will be time series graph.
Question 47.
Name the curve which helps in showing the Median?
Answer:
Cumulative frequency curve or ogive.
Question 48.
What is False base line?
Answer:
If the values in a series are very large and the difference between the smallest value and zero is high and if these values are to be indicated only axis of the graph then the Y axis is started somewhere above the point ‘O’.
Question 49.
What is tabular presentation?
Answer:
A statistical table is a systematic organization of data in columns and rows.
![]()
Question 50.
What is chronological classification?
Answer:
When data are classified on the basis of time, it is known as chronological classification.
Question 51.
What is geographical classification?
Answer:
This classification of data is based on the geographical or locational differences of the data.
Question 52.
What is tabulation?
Answer:
Tabulation involves the orderly and systematically presentation of numerical data in a form designed to elucidate the problem under consideration.
Question 53.
What is simple bar diagram?
Answer:
Simple bar diagrams are those diagrams which are based on a single set of numerical data.
Collection, Organisation and Presentation of Data Short Answer type Questions
Question 1.
In a village of 200 farms, a study was conducted to find the cropping pattern. Out of the 50 farms surveyed, 50% grew only wheat. Identify the population and the sample here?
Answer:
The population or the universe in statistics means totality of the items under study. It is a group to which the results of the study are intended to apply. In this case, the population is 200 farms in the village. A sample refers to a group or section of the population from which information is to be obtained. A good sample (representative sample) is generally smaller than the population and is capable of providing reasonably accurate information about the population. In this case, the sample is 50 farms which are surveyed.
![]()
Question 2.
Give two examples each of sample, population and variable?
Answer:
Example 1:
A study was conducted to know the average weight of students of class tenth in Raipur. The total number of students in class tenth was 1200. Out of these 200 students were randomly selected and their weight was recorded. In this example:
- Population is, the numbers of students of class tenth in Raipur, the total number of which is equal to 1200.
- Sample is, the 200 students selected whose weight was recorded.
- Variable under study, is the weight of the students.
Question 3.
Which of the following methods give better results and why?
- Census and
- Sample.
Answer:
In terms of accuracy of results, census is better as it studies all the units of population but this method is very time consuming, expensive and sometimes not feasible to use. Hence, sampling is better due to following reasons:
1. Economical:
Sampling involves study, of a fraction of population and hence, the cost involved in sampling is relatively low.
2. Time Saving:
Huge amount of time is required to conduct a census survey while sample studies do not take that much time.
3. Lesser Effort:
As only a part of the population is studied, it entails lesser effort on the part of the investigator than that required in census.
4. Considerable Accuracy:
Results from sampling may not be as accurate as in case of sampling but the level of accuracy of these results can be established through statistical tests of significance and hence can be applied in general to the whole population if found significant.
![]()
Question 4.
Which of the following errors is more serious and why?
- Sampling error and
- Non – sampling error.
Answer:
1. Sampling error refers to the difference between the sample estimate and the actual value of a population characteristic. This type of error occurs when one makes an observation from the sample taken from the population. It is possible to reduce the magnitude of sampling error by taking a larger sample.
2. Non – sampling errors are more serious than sampling errors because a sampling error can be minimised by taking a larger sample but it is difficult to minimise non – sampling error, even by taking a large sample. Even a Census can contain non – sampling errors. These include errors in data acquisition, non – response errors and sampling bias.
Question 5.
Suppose there are ten students in your class. You want to select three out of them. How many samples are possible?
Answer:
In general, you use combinations to determine the number of ways you can select a sample of size n from a population of size N. The formula for the number of such combinations is: N!/(n!)(N – n)! Where, N! (spoken “N factorial”) equals N (N – 1) (N – 2) ………………………. (3) (2) (1)
eg., 5! = (5) (4) (3)(2) (1) = 120
In this problem, our population size is N = 10 students, and our sample size is n = 3 students. Number of samples possible can be calculated as follows:
Number of samples = 10!/(3)! (7)!
Number of samples = 10!/ (3!) (7)!

= 120 Possible random samples.
Question 6.
Discuss, how you would use the lottery method to select three students out of ten in your class?
Answer:
A representative (random) sample of 3 students can be taken out of 10 through lottery method. The names of all the 10 students of the class are written on 10 separate pieces of paper of equal size and all the slips are folded in a similar manner. These slips are then mixed well and 3 slips with these names are selected one, by one, so that all the students have equal chance of being selected in the sample.
Question 7.
Does the lottery method always give you a random sample? Explain?
Answer:
Lottery method always gives a random sample if it is used in the proper manner without any bias. If the slips are prepared properly and drawn out one by one so that all the slips have equal chance of being selected in the sample, it will definitely give a random sample.
Similarly, if the same name or number is written on more than one slip and if some name or number is missed then also the chances of selection of different units of population in the sample will not be equal. In such cases even lottery method will not give random sample. ‘
![]()
Question 8.
Explain the procedure of selecting a random sample of three students out of ten in your class, by using random number tables?
Answer:
Random number tables have been devised to guarantee equal probability of selection of every individual unit in the population according to their listed serial number in the sampling frame. They are available either in a published form or can be generated by using appropriate software packages. The procedure of selecting a random sample of 6 students out of 20 in a class, by using random number tables is as follows:
1. Assign a specific number between 1 and 20 to all the 20 students.
2. Here, the largest serial number is 20 which is a two digit number and therefore we consult two digit random numbers in sequence.
3. We can start using the table from anywhere, i.e., from any page, column, row or point and select the first number randomly. We need to select a sample of 6 Students out of 20 total students.
4. We will select two more numbers from the table according to sequence. We will skip the random numbers greater than 20 since, there is no student number greater than 20. Thus, the 6 selected students are with serial numbers.
![]()
Question 9.
Do samples provide better results than surveys ? Give reasons for your answer?
Answer:
A survey, which includes every element of the population, is known as Census or the Method of Complete Enumeration. On the other hand, when a part of the population is studied and predictions are made about the population based on this part, it is called sampling.
In terms of accuracy of results, census is better as it studies all the units of population but this method is very time consuming, expensive and sometimes not feasible to use. Hence, sampling is better due to following reasons:
1. Economical:
Sampling involves study of a fraction of population and hence, the cost involved in sampling is relatively low. Census costs are high especially in case of large population with wide coverage in terms of area.
2. Time Saving:
Huge amount of time is required to conduct a census survey if the population size is large or spread over a wide area while sample studies do not take that much time to be conducted.
3. Lesser Effort:
As only a part of the population is studied, it entails lesser effort on the part of the investigator than that required in census.
Question 10.
What is a variable? Distinguish between a discrete and a continuous variable?
Answer:
A variable may be defined as a certain characteristics which is numerically described. For example, height, weight, income, turnover, export etc., are variable because these are capable of being measured by some unit. A discrete variable is a variable which has an exact value. A continuous variable is a variable, which can take any numerical values.
![]()
Question 11.
Explain the ‘exclusive’ and ‘inclusive’ methods used in classification of data?
Answer:
Following are the two method used in the classification of data:
1. Exclusive method:
Exclusive method is the method in which upper limit of each class becomes the lower limit of the next class but upper limit is excluded from the class interval and lower is included in the class – interval. For example, 0 – 10, 10 – 20, 20 – 30 etc. 10 will be included in class – interval 10 – 20.
2. Inclusive method:
Inclusive method is the method in which upper limit of the class – interval is not same as the lower limit of the next class – interval. Thus, both the lower and upper limits are part of the interval. For example, 1 – 10, 11 – 20, 21 – 30 etc. 10 will be included in class – interval 1 – 10.
Question 12.
What is ‘Loss of information’?
Answer:
Classification of data in concise and comprehensive, yet it suffers an inherent shortcoming. It does not present the details which are available in raw data. This is a loss of information in classification data.
Question 13.
Do you agree that classified data is better than raw data?
Answer:
The raw data is usually large and fragmented and it is very difficult to draw any meaningful conclusion from them. Classification makes the raw data comprehensible by summarizing them into groups. When facts of similar characteristics are placed in the same class, it enables one to locate them easily, analyse them, make comparison and draw inferences.
![]()
Question 14.
Distinguish between univariate and bivariate frequency distribution?
Answer:
The term “uni” stands for one and thus the frequency distribution of a single variable is called a univariate distribution, e.g., the frequency distribution of age of students in a class is univariate as its gives the distribution of a single variable i.e., age.
On the other hand “bi” means two and a Bivariate Frequency Distribution is the frequency distribution of two variables, e.g., the frequency distribution of two variables, e.g., like price of good and sales of the good is a bivariate distribution.
Question 15.
Prepare a Frequency distribution by inclusive method taking class interval 7 from the following data:

Answer:

Question 16.
How does the procedure of drawing a histogram differ when class intervals are unequal in comparison to equal class intervals in a frequency table?
Answer:
A histogram is a set of rectangles with bases as the intervals between class boundaries (along X – axis) and with areas proportional to the class frequency. If the class intervals are of equal width, the area of the rectangles are proportional to their respective frequencies.
However, sometimes it is convenient or at times necessary, to use varying width of class intervals. For graphical representation of such data, height for area of a rectangle is the quotient of height i.e., frequency and base i.e., width of the class interval.
When intervals are equal, all rectangles have the same base and area can conveniently be represented by the frequency of the interval. But, when bases vary in their width, the heights of rectangles are to be adjusted to yield comparable measurements by dividing class frequency by width of the class interval instead of absolute frequency. This gives us the frequency density for the purpose of comparison.
Thus,

Question 17.
What is meant by primary data and secondary data? Which of the two is better and why?
Answer:
Primary data means the data collected for the first time by the investigator as original data. Secondary data means the data which has already been collected originally by someone for some other purposes and are used by an investigator in his investigation. Secondary data is better if data are reliable, adequate the suitable for the purpose of enquiry because it is most economical in terms of money, labour and time.
Question 18.
Write four qualities of a good questionnaire?
Answer:
Although it is not easy to identify the qualities of good questionnaire in all the cases. However, a good questionnaire must have the following qualities:
1. Simple and clearly explanation:
The question should be short, simple and clearly warded. Technical terms which are difficult to understand should be avoided.
2. Questions should be properly sequenced:
It is important that the questions should be properly arranged to avoid confusions. The arrangement should be logical and divided into groups and sub – groups for easy understanding.
3. Questions should be directly related:
The question must relate to the investigation to be carried out unrelated questions can create controversy in the data collection process.
4. Yes or no questions:
It is desirable that all or most of the questions should be in “Yes or no” form. It helps in answering these questions easily and correctly by the respondent.
5. Personal question should be avoided:
Question like level of income, sources of sales, relationship with business partners etc. should be avoided. They may not be answer-able by the respondent.
6. The questionnaire should be brief:
The number of questions should be small as well as possible.
![]()
Question 19.
Explain the merits of census method?
Answer:
Merits:
1. The results are more accurate and reliable:
The data collected through census method of investigation are more true and reliable, because every item of the universe is enquired into. Therefore, the results obtained from such an enquiry are likely to be more accurate and reliable.
2. Suitability:
It is an appropriate method, where units of diverse characteristics constitute the universe.
3. Intensive study:
In the census investigation intensive information is obtained from each and every item, thus, many facts of the problems are brought to light. For example, In a population census not only the magnitude of population is known but information is made available on various other points, such as age, marital status, education, sources of income etc.
Question 20.
What are the essentials of a good sampling?
Answer:
To draw unbiased and real conclusions about the universe by a sample investigation, the sample should possess the following essentials:
1. Representatives:
The securing of a representative sample is the first essential of the method of statistical induction or inferences. The sample taken should be such to possess the same characteristics as those possessed by the original universe from which it has been taken out.
2. Independence:
In a simple sampling, the individual items composing the sample should be independent of each other.
3. Homogeneity:
There should not be any basic difference in the nature of units of the universe and that of the sample. If two samples from the same universe have been taken out, they should be similar.
4. Adequacy:
The number of units in the sample should be adequate so as to make the results more accurate.
![]()
Question 21.
Distinguish between Purposive sampling and Random sampling?
Answer:
Differences between Purposive sampling and Random sampling:
Purposive Sampling:
- The investigator himself makes the choice of sample items.
- These are possibility of personal bias.
- Reliability of results become doubtful.
Random sampling:
- Each and every items of universe stands equal chances of being selected.
- It is free from personal bias.
- Reliability of results does not become doubtful.
Question 22.
Write any three demerits of stratified sampling?
Answer:
The demerits of stratified sampling are:
- It is very expensive method.
- These are possibility of bias at the time of classification of the population into different strata.
- This method has a limited scope as if requires complete knowledge regarding di-verse characteristics of population.
![]()
Question 23.
Write any four merits of sampling method?
Answer:
Merits:
1. Inexpensive:
This method is economical in terms of time, money and efforts involved as only some units of the populations are studied.
2. Useful for large investigation:
Sample method is more feasible for large investigations as compared to census method which involves huge cost.
3. Error identification:
Since only a limited number of items are studied under sample method, error identification becomes easier.
4. Administrative convenience:
Since only a limited number of items are to be handled, there is administrative convenience. More competent investigators can be employed who can study a sample scientifically.
Question 24.
Write any three demerits of sampling method?
Answer:
Demerits:
1. Biased:
It may involve investigator’s biasness in the selection of the samples, so the results can be biased and partial.
2. Inaccurate results:
If the representative samples do not represent the character¬istics of the entire population, the investigator may get inaccurate results.
3. Difficult to frame samples:
It is difficult to select a sample that represents the characteristics of the entire universe, if the items in the universe are very diverse.
4. Technical knowledge required:
Sampling method is technical by nature. Specialized knowledge is required for selecting a sample and people with such technical knowledge are not easily available.
![]()
Question 25.
Distinguish between sampling and non – sampling errors?
Answer:
The essential requirement of the sampling is that the sample must be representative of the population, with regard to the characteristic under consideration. If it does not happen, the estimated value will be different from the true value. Thus, sampling error means the difference between sample estimate and the true value.
Sampling errors may be defined as the errors which arise due to sample of the population. On the other hand, non – sampling errors means which arise due to human factors like errors of measurement, errors due to mishandling of the questionnaire, errors of recording, errors of non – response etc. Sampling errors arise only in case of sample investigation while non-sampling errors are found in census as well as sample investigation.
Question 26.
What is random sampling? Why is considered to be the best sampling method?
Answer:
Random sampling is that method of sampling in which each unit of the universe has an equal chance to be included in the sample. The investigator does not exercise his discretion on judgment in the selection of items. There are two important methods of obtaining a random sample:
- Lottery method and
- Random sampling numbers.
It is considered to be best sampling method because selection of items is free from personal bias.
![]()
Question 27.
What is classification of data? Write its merits?
Answer:
Classification of data is a technique which divide the collected data into various groups.
Merits:
- It eliminates unnecessary information and present the complex data in simple and logical form.
- Classification helps in comparing datas.
- It helps in finding the relationship between various variables.
Question 28.
What are the important requisites of a good classification?
Answer:
Classification of data will be effective only if it possesses the following essentials:
- It should be unambiguous i.e., it should be clearly understood.
- It should be flexible or elastic.
- It should be free from fluctuations.
- It should be clearly defined.
- Qualitative classification of data should be expressed in such a way that all attributes are clearly mentioned.
Question 29.
Distinguish between Discrete variable and Continuous variable?
Answer:
Differences between Discrete variable and Continuous variable:
Discrete Variable:
- Discrete variables are those that increase in jumps or in complete numbers like 2, 4, 6, 8 etc.
- These variables are expressed in terms of complete numbers.
Continuous variable:
- Variables that assume a range of values or increase not in jumps but continuously in fractions is known as continuous variables like 2 – 4, 4 – 6, 6 – 8 etc.
- These variables are in fractions.
![]()
Question 30.
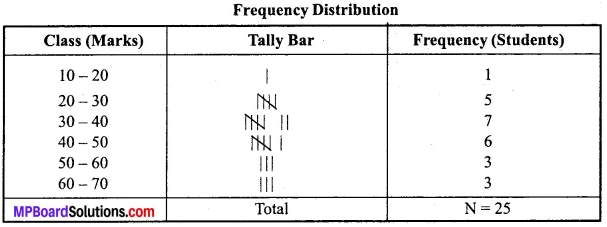
In an examination 25 students have the following marks. Prepare a frequency distribution table taking 10 – 20, 20 – 30, 30 – 40, 40 – 50, 50 – 60 and 60 – 70 as class – intervals?
28, 23, 32, 43, 40, 19, 51, 50, 38, 30, 58, 61, 65, 36, 29, 45, 60, 26, 35, 43, 49, 49, 37, 36, 65?
Answer:
Frequency Distribution
Question 31.
Differentiate between classification and tabulation?
Answer:
- Objective of classification is to analyse the datas. While objective of tabulation is to present the datas.
- Classification is to be done before tabulation as tabulation presents the data which is classified in an orderly manner
Collection, Organisation and Presentation of Data Long Answer Type Questions
Question 1.
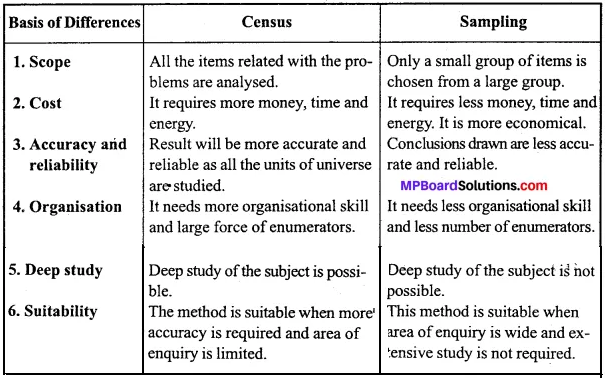
Distinguish between census and sampling method of investigation?
Answer:
Differences between Census and Sampling method of investigation:
![]()
Question 2.
Explain the methods of collecting primary data?
Answer:
The methods of collecting primary data are as follows:
1. Direct personal investigation:
Under this method the investigator interviews personally everyone who is in a position to supply the information he requires. The investigator makes personal contact with the informants and conducts on the spot enquiry. This method of data collection is suitable when the field of enquiry is limited or the nature of enquiry is confidential and when maximum degree of accuracy is desired.
In direct personal investigation method the investigator himself collect the information. So he should have the practical knowledge. He should be well conversed with the local language and custom of that place otherwise he may find lot of problems in collecting data.
For example, if a person wants to collect data about the monthly expenditure of students of a particular school, then he will have to go to school and contact students and collect desired data. In this method the number of questions should be less, it should be simple and it should be clear. Direct personal investigation requires skill, tact, accuracy on the part of investigator.
2. Indirect oral investigations:
Indirect oral investigation method is adopted where informants hesitate in giving data or information and where nature of data is so complicated that they cannot be obtained directly. This method is used by enquiry commission and committees.
In this method the information is not obtained directly from the persons related to problems. But the information is gathered indirectly from them. For example, the information about the pressure of debt is not directly obtained from the person who has borrowed the money. The information about it is gathered from Sahukar, Mahajan, Leaders of villages and from other important persons.
3. By local correspondents:
Under the method local persons or correspondents are appointed in different parts of the area to be investigated. They collect information in their own way and present it to the investigator. These correspondents are trained to collect the information from the respondents.
Radio and newspaper agencies generally obtain information about strikes, thefts, accidents etc. by this method. Example: It is adopted by government departments to get estimates regarding crops, wholesale price index number and other areas of public interest.
4. Questionnaires to be filled by informants:
Under this method a schedule or questionnaire is prepared. This is the best method of collecting primary data. Under it investigator prepares the questionnaire related to problem and sent by post to the person who is related to problem. Along with the questionnaire one request letter is also sent to informants in which in short the need of information and aim is given.
The investigator expects full cooperation from informants which is also mentioned in the request letter. It is also assured that the information will be kept secret. The questionnaire is expected to fill within specific mentioned time.
5. Scheduled to be filled by enumerators:
In this method, a questionnaire prepared according to the objective of study is taken to the informants by trained enumerators, who help the informants in recording their answers. The enumerator himself approaches the informants with questionnaire and asks them questions which are called schedules.
Enumerator fills the questionnaire himself after seeking information. Enumerators are the persons who help the investigators in collecting the data. They are trained to fill the schedules and put forward the questions intelligently to procure accurate data.
![]()
Question 3.
What are the merits and demerits of Indirect oral investigation method?
Answer:
Merits:
1. Covers wide areas:
This method covers a wide area of investiga-tion. This method can be used when field of enquiry is large.
2. Cost effective:
Since it saves labour, time and money, it is less expensive than Direct Personal Investigation.
3. Simple:
This method of data collection is relatively simple and convenient.
4. Expert opinion:
Since investigator can seek expert opinion, data collected are reliable.
Demerits:
1. Lack of accuracy:
As the information is obtained from the third party (witnesses) and not from the person directly concerned, there is a possibility of not getting true information.
2. Personal bias:
There is a possibility of information being biased as various evidences obtained may sometimes be exaggerated by the witnesses.
3. Doubtful conclusions:
The conclusions may be doubtful due to carelessness or lack of information with the witnesses.
![]()
Question 4.
What are the merits and demerits method of schedules to be filled by enumerators?
Answer:
Merits:
1. Wide coverage:
It can cover a wide area. It can be used even when people are illiterate.
2. Accurate and reliable:
Accurate and reliable answers can be obtained because of personal contact between informants and trained enumerators.
3. Personal contact:
This method allows personal contact between the enumerator and informants. So, this ensures reliability.
4. Complete information:
Since questionnaires are filled by enumerators them-selves, these are complete in all regards as this method ensures complete response.
Demerits:
1. Costly:
Since this method involves skilled enumerators, it is very expensive.
2. Time consuming:
This method is also costly in terms of time. Enumerators may require specialised training which is time consuming.
3. Biased:
This method is not free from the bias of the enumerators. They might fill wrong information if they are biased towards informants.
4. Unsuitable for small investigations:
Since this method involves a lot of cost, it is unsuitable for small private investigations. So it is usually used by government department and some well off private organisations.
![]()
Question 5.
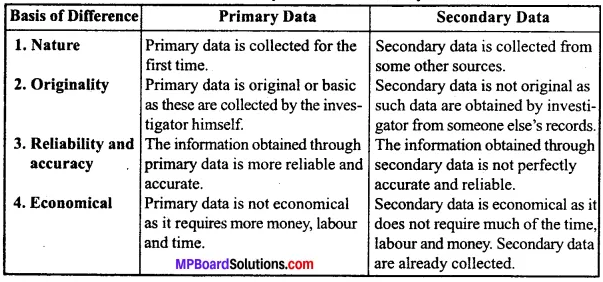
Distinguish between Primary data and Secondary data?
Answer:
Difference between Primary data and Secondary data:
Question 6.
Define tabulation and describe its significance?
Answer:
Tabulation is a systematic and logical presentation of data so that it is easily understandable and comparable.
1. Presentation is Simplified Form:
Tabulation presents the data in a systematic and simplified form so that it is easily understandable to a common man.
2. Trend and Pattern of Data:
Tabulation discloses the trend and pattern of data.
3. Economy in Space and Time:
Tabulation discloses the trend and pattern of data.
4. Comparison:
Tabulation facilitates comparison of data.
5. Statistical Analysis:
Tabulation facilitates statistical analysis by the use of averages, dispersion, correlation etc.
![]()
Question 7.
What is a table? Describe the essential parts of a table?
Answer:
A table is a method of presentation of statistical data systematically arranged in rows and columns.
Following are the essential parts of a table:
1. Title:
Every table must have a suitable title at the table so that the reader gets an idea about the contents of the table.
2. Table Number:
Every table should be serially numbered so that it becomes easier for reference in future.
3. Head Notes:
Head note refer to brief statement for explaining any points not included in the heading.
4. Captions and Stubs:
Captions and stubs are heading for the vertical columns and horizontal rows in a table respectively.
5. Body of the Table:
Body of the table contains the numerical information which is presented to the users.
6. Footnotes:
Footnotes clarify heading title, captions, stub etc. Footnote is given at the bottom of a table.
Question 8.
Explain the utility of diagrammatic presentation?
Answer:
The utility of diagrammatic presentation of data will be clear from the following points:
- The impression created by diagrams, lasts much longer than those presented in a tabular form.
- Diagrammatic presentation of data saves much time and labour in compression to other techniques of presentation of data.
- Diagrams are attractive and have great memorizing effect.
![]()
Question 9.
What points should be considered while constructing a diagram?
Answer:
Following points should be considered for constructing a diagram:
- The diagram should bear a number and heading.
- Both X and Y – axis must be clearly labelled.
- Units of measurements of the variables should be stated at the top right hand comer of the diagram or just below the diagram.
- The choice of origin should be clear from the diagram.
Question 10.
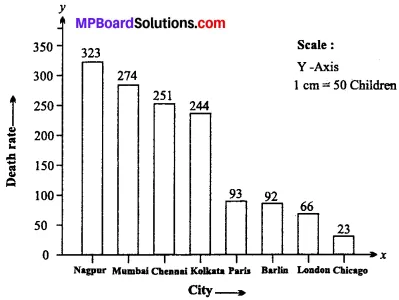
On the basis of following data of death rate of various cities prepare a simple bar diagram?

Answer:
Question 11.
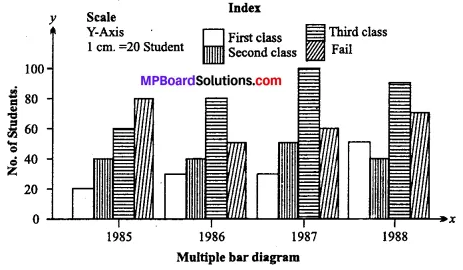
Following table shows the results of students of class 10th prepare a multiple bar diagram?

Answer:
Question 12.
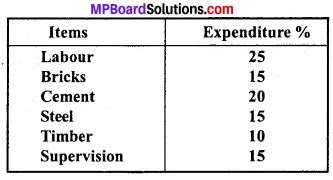
Construct a pie – diagram to represent the cost of construction of house in Delhi?
Answer:
For constructing a pie – diagram, it is necessary to percentages into of different degrees:
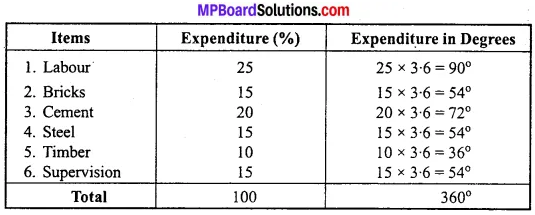
Cost of Construction of a House in Delhi:
